 CALL US NOW
 TEXT US NOW
Most Dangerous US Cities to Work In
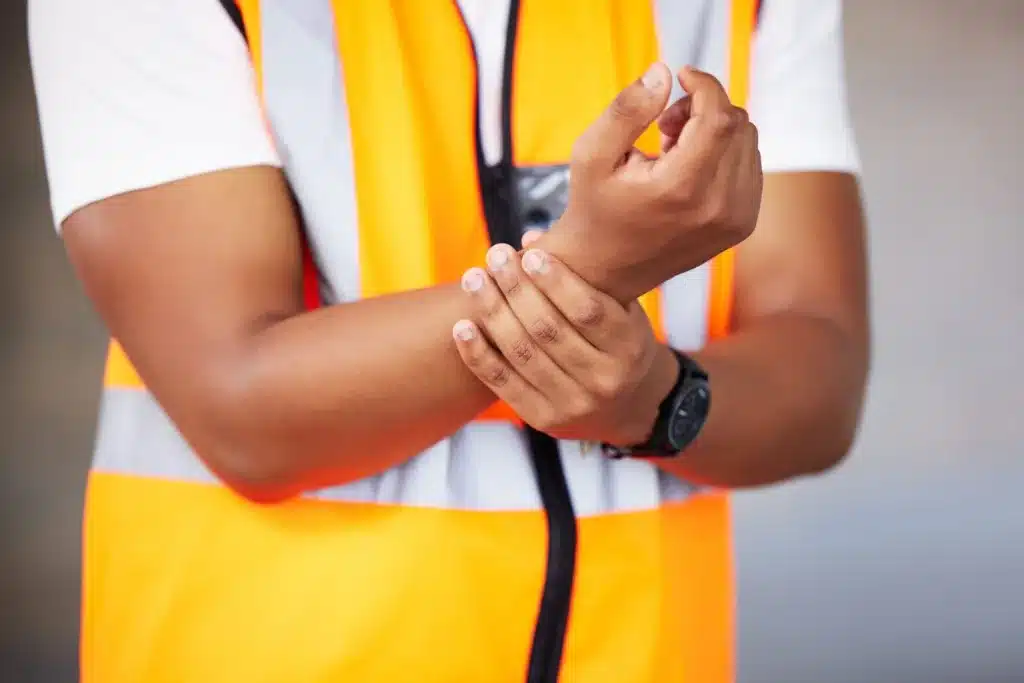
Every workday in America, 15 workers lose their lives on the job; a grim reminder that for millions of Americans, simply showing up to work may carry inherent risks that extend far beyond the typical office hazards of paper cuts and strained eyes. Moreover, with the industrial complexes moving from Europe to the US, the cases of injuries or fatalities at work may increase in the future.
While safety at work has improved over the last 50 years, falling from 10.9 incidents per 100,000 workers in 1972 to 2.4 incidents per 100,000 in 2023, it reminds us of the shared reality. In 2024, the national average for serious injuries was 13.9 per 100,000 workers, while the national fatality rate was 3.7 deaths per 100,000 workers. The risk employees take while working has a profound economic cost, as workplace injuries cost an estimated $250 billion annually.
However, despite the remarkable improvement, these national statistics mask a crucial truth: your risk of serious injury and/or possible death has to be considered in the context of your occupation. Moreover, geographic location matters when identifying workplace risks, as workers in some cities may experience potentially far worse outcomes because of industrial concentration, regulatory practices, local safety culture, or economic conditions.
The study from RTRLAW presents data about the most dangerous states and cities in America for workers. Using federal injury and fatality databases, along with employment demographics and industries, it identified where the simple act of making a living came with the highest price tag. The study showed that there are major differences in worker safety across America, exposing environments that pose increased risk to workers.
At RTRLAW, we strive to meet the legal needs of workers injured on the job and those families that have lost a family member in a preventable workplace accident. Our attorneys, who are experienced in their respective areas, including all aspects of workers’ compensation and employer negligence, recognize the nuances that may arise for injured workers and advocate for their clients’ full compensation. Our clients receive the representation they need to stand up to the insurance companies when they refuse to provide compensation.
Key Findings:
- Ellabell, Georgia, has a severe injury rate of 74 per 100k workers, which is over 3,000 times higher than Los Angeles’s rate of 0.03 per 100k. This represents one of the largest workplace safety disparities ever documented in American cities.
- America’s largest metropolitan areas dominate the safest cities list, with New York-Newark (10+ million employed), Los Angeles-Long Beach (6.7+ million employed), and San Francisco-Oakland (2.4+ million employed) all showing injury rates below 0.22 per 100k.
- Among the most dangerous states is Ohio, leading with 4 cities in the top 10 most dangerous list, while Florida and Georgia each contribute 2 cities each.
- A clear pattern was noticed that the cities with over 1 million workers are among the safest, which can be attributed to the high concentration of office jobs and IT companies. On the other hand, cities with under 10,000 workers consistently dominate the most dangerous ranking, which is a signifier that smaller cities are more industrial, require hands-on work, and ultimately lead to more risks.
- Nearly all the safest cities are located on the East or West coasts, with coastal metropolitan areas showing steadily low injury rates while inland industrial cities dominate the dangerous rankings.
- The national average of 282 analyzed cities yielded 9 severe injuries per 100k employees.
- As of 2025, nearly 1 million USA residents were employed across all States.
What Makes Certain Work Risky
The level of risk is highly industry-dependent, and construction remains one of the most dangerous industries in America. The construction industry accounts for 19-20% of all worker deaths in the US annually, despite representing a smaller portion of the workforce. In 2020, construction workers had a fatal injury rate of 9.6 per 100,000 workers, while construction trades helpers specifically experienced a fatal work injury rate of 38.5 per 100,000 workers. This shows how particular positions in high-risk industries can be enormously more dangerous.
On the other hand, service-based economies have safer working conditions. The safest cities in our data, including New York-Newark, Los Angeles-Long Beach, and San Francisco-Oakland, have primarily white-collar industries related to retail, professional services, and IT. The following industries typically involve minimal exposure to heavy machinery, hazardous materials, or elevated work surfaces that drive injury rates in industrial settings.
Additionally, a predictable pattern of injuries is created by physical hazards. For instance, construction workers face physical hazards, and as the analysis showed, the most common type of injury is fingers and thumb(s) with 2,377 cases registered, followed by hip joint(s) with 489 cases. The concentration of heavy machinery, elevated work surfaces, electrical systems, and moving materials in industrial settings creates environments where a single mistake or equipment failure can result in severe injuries or fatalities, explaining why smaller industrial cities in our data show injury rates hundreds of times higher than service-based metropolitan areas. Some of the causes for injury registered were “an employee got injured while just stocking shelves and changing posture” and “an employee added chemicals to a mixer, which caused a dust explosion”.
April Gibson
I must admit first impression was a little iffy as it had been a week since my husband signed papers and we hadn't heard anything. Today I emailed and said that I hadn't heard anything from them in almost a week and I wasn't even sure who my husband's attorney was. Within minutes I was receiving a phone call from the law firm and the gentleman put me in touch with my husband's paralegal who works with his attorney and she did an intake and was very friendly. Her name was Emily chica. She answered all my questions she let me explain everything about my husband's injury that I felt she needed to know even if she didn't need that information she still let me explain it. She gave me a very detailed timeline of how the next several months will go with the case and told me in order of everything that would be happening next. Then she also gave me the date and time that she'll be calling us and checking in with an update, which is one week away. She was kind and concerned and asked how we were doing since my husband is on unpaid FMLA leave. Even though my husbands job told him he could not return to work until certain stipulations were signed she reassured us that the disposition she sends to workers comp would see to it that he sees the doctors he needs to see at which point those doctors would give specifications for my husband to return to his normal job or his job would have to find him a different position to do and if that was not possible then they would have to pay him for being at home. This was comforting to hear since we unfortunately solely rely on my husband's income and we also have three children two of which are starting back to school and need school supplies, school clothes, haircuts, & new shoes. So I am optimistic and feel confident in our choice to work with this Law firm.
The Most Dangerous and Safest Cities To Work In
The research ranks U.S. cities with the most serious rates of workplace injuries, where workers are enduring extraordinary risks that are higher than national averages. Ellabell, Georgia, tops the list with an astounding severe injury incidence rate of 726.74 per 100,000 workers. According to the data, it can be assumed that 1 of every 137 workers suffers a severe injury each year. Georgia dominates the most dangerous rankings with two first cities in the top 15, including Adairsville (311.11 per 100k), followed by Fort Pierce, Florida (270.27 per 100k), while Ohio contributes four cities to this dangerous list, from Groveport (258.06 per 100k) to Marietta (138.72 per 100k). The most dangerous cities tend to be industrial centers with populations less than 35,000 residents and severe injury rates that are extremely higher than in large metropolitan areas. These cities exhibit workplace environments where making a buck can result in life-altering vulnerabilities that require urgent safety attention by regulators, employers, and legal advocates who can ensure injured workers are compensated.
Ellabel, Georgia, is considered the most dangerous city in the U.S. to work in. With only 1,400 employed in 2024 and 10 recorded cases, the city demonstrates the 1st highest rate of 726 severe injuries per 100,000 workers within the country.
Los Angeles-Long Beach-Anaheim, California, is considered the safest city in the U.S. to work. With 6,694,398 workers in 2024 and 2 registered cases, the incident rate of serious injuries per 100,000 workers is only 0.03, which is the lowest index in the United States, suggesting that the service-based economy fosters a safe workforce environment.
Top 10 Most Dangerous Cities To Work In
| Rank | State | City | Employed 2024 | Severe injuries per 100k |
| 1 | Georgia | Ellabell | 1,376 | 726.74 |
| 2 | Georgia | Adairsville | 2,250 | 311.11 |
| 3 | Florida | Fort Pierce | 2,590 | 270.27 |
| 4 | Ohio | Groveport | 3,100 | 258.06 |
| 5 | Florida | Green Cove Springs | 3,920 | 178.57 |
| 6 | Texas | Pecos | 6,370 | 141.29 |
| 7 | Ohio | Marietta | 5,046 | 138.72 |
| 8 | Pennsylvania | Elizabethtown | 6,490 | 107.86 |
| 9 | Ohio | Medina | 13,600 | 51.47 |
| 10 | Ohio | Mentor | 24,800 | 32.26 |
Top 10 Safest Cities To Work In
| Rank | State | City | Employed 2024 | Severe injuries per 100k |
| 1 | California | Los Angeles-Long Beach-Anaheim | 6694398 | 0.03 |
| 2 | California | San Francisco-Oakland-Fremont | 2486083 | 0.04 |
| 3 | Washington | Seattle-Tacoma-Bellevue | 2310863 | 0.043 |
| 4 | Michigan | Detroit-Warren-Dearborn | 2160518 | 0.046 |
| 5 | Maryland | Baltimore-Columbia-Towson | 1489469 | 0.067 |
| 6 | Oregon | Portland-Vancouver-Hillsboro | 1377121 | 0.073 |
| 7 | Arizona | Phoenix-Mesa-Chandler | 2703656 | 0.074 |
| 8 | Indiana | Indianapolis-Carmel-Greenwood | 1140702 | 0.088 |
| 9 | North Carolina | Raleigh-Cary | 847399 | 0.118 |
| 10 | North Carolina | Charlotte-Concord-Gastonia | 1481565 | 0.135 |
Costs of Severe Injuries
The average workers’ compensation settlement amount in the United States is approximately $66,659, with a median of $38,331, though most workers receive between $2,000 and $40,000 for their claims. The body part injured significantly affects compensation levels, where an injured neck settlement is roughly $68,000, and an arm or shoulder is $51,750, with head injuries among the most severe and costly, averaging around $93,942 in settlements, while injuries affecting multiple body parts lead to settlements averaging $71,645. For all the dangerous cities, where injury rates exceed 700 injuries per 100,000 workers, the total costs of individual claims multiply exponentially into financial obligations that can devastate small employers and put a strain on insurance capacity, affecting the availability of coverage for all workers in those locations.
How To Protect Yourself At Work
Employers and employees are accountable for developing an effective and safe working environment. The employers are responsible for ensuring that employees are educated on safety guidelines and are wearing appropriate personal protective equipment (PPE). Other practices include recognizing your surroundings and possible changes, as well as reporting unsafe conditions. Employers need to promote safety discussions openly, as any hazard report improves the working environment and safety. Unfortunately, many times preventable work injuries occur due to either a late report about unsafe conditions, or the issue was never reported. Additional safety training, as well as feedback sessions on potential pitfalls, may help ensure you are not working in an endangered environment.
What To Do If You Get Injured At Work
Take immediate action: if you are injured at work, you should first get medical attention as soon as possible, even if you have a minor injury. Remember that some injuries can get worse with time. Once you are injured, your employer must either take you to the employer’s medical facility, a walk-in clinic, a hospital, or a designated specialist to get medical help. You must inform your employer of the injury immediately and have it documented in writing, as each state has a time limit for filing workers’ compensation claims related to workplace injuries, illnesses, and fatalities. Prepare a detailed report of what happened, when it happened, any witnesses present, and keep a record of all the medical treatment you received. Any of the aforementioned documentation will help build your case.
Get professional help: workers’ compensation should cover your medical expenses and lost wages, but the reality is that insurance companies tend to minimize payouts, deny legitimate claims, and stall processing claims to pressure you into accepting unfair settlements. If your employer or insurance refuses to provide you with medical treatment, then you can seek assistance from the Commission, but navigating this complex system while recovering from an injury can be overwhelming. This is where RTRLAW can help; our attorneys have experience and knowledge of the tactics insurance companies use, and we will work diligently to ensure that you receive all the compensation you deserve. Do not accept the first settlement offer, and do not communicate with insurance companies by yourself, particularly if you’re facing long-term disability, disputed coverage, or inadequate compensation. In the high-risk cities identified in our analysis, where severe injuries are more common, having skilled legal representation isn’t just helpful, but essential for protecting your rights and securing your financial future.
Methodology: How We Ranked States & Cities
Data Collection: Workplace injury data was systematically collected from OSHA.gov using automated Python scripts to ensure comprehensive coverage and data consistency. The collection process focused on gathering registered injury cases, employment figures, and demographic information for all available cities across the United States. This automated approach eliminated manual data entry errors and ensured standardized data extraction across all geographic locations.
Sample Requirements: The study examined all cities and states in the U.S. with any and all complete workplace injury and employee counts data in OSHA databases. To be included in the final analysis, each city needed to have the following data: (1) recorded workplace injury cases that have been recorded with OSHA data, (2) total employee count for the year 2024, and (3) demographic data to produce injury rates per 100,000 workers. Any city with missing data was excluded from the research to ensure the integrity of the analysis.
Final Dataset: The final dataset consists of 282 cities that met all of the needed criteria. This total represented a complete cross-section of American cities in every state within the U.S. Each entry-state included the number of registered injury cases, total employed population as of 2024, generated severe injury rates per 100,000 workers (100,000 employees), and basic demographic information. The study included a range of cities, from small cities as few as industrial communities with less than 2,000 employees, up to major metropolitan areas employing millions of residents.
Study Limitations: There are several limitations to note when interpreting the findings. This analysis relies on OSHA-registered injuries and cases, which may not represent the actual injury rates in industries that do not have reporting compliance or are otherwise exempted from OSHA regulation. This study included the investigative definition of severe injuries, as laid out by the parameters of OSHA’s report recording, but did not account for other injuries, such as minor injuries or near-miss events that could provide contextual indications of safety concerns. Additionally, the reporting-based values of the data were taken at 2024, and therefore, did not account for seasonal employment fluctuations or more recent local industry changes that could impact injury occurrence patterns.
| State | City | Severe Injuries per 100k |
| Georgia | Ellabell | 726.74 |
| Georgia | Adairsville | 311.11 |
| Florida | Fort Pierce | 270.27 |
| Ohio | Groveport | 258.06 |
| Florida | Green Cove Springs | 178.57 |
| Texas | Pecos | 141.29 |
| Ohio | Marietta | 138.72 |
| Pennsylvania | Elizabethtown | 107.86 |
| Ohio | Medina | 51.47 |
| Ohio | Mentor | 32.26 |
| Ohio | Delaware | 30.84 |
| Missouri | Saint Joseph | 30.62 |
| Ohio | Middletown | 30.3 |
| Texas | Midland | 27.13 |
| Florida | Wildwood-The Villages | 26.44 |
| Georgia | Dalton | 25.3 |
| Arkansas | Pine Bluff | 25.2 |
| Oklahoma | Enid | 21.24 |
| Arkansas | Jonesboro | 21.22 |
| Missouri | Saint Louis | 20.58 |
| Alabama | Cullman | 20.05 |
| Texas | Odessa | 19.78 |
| Georgia | Macon-Bibb County | 18.6 |
| Florida | Naples-Marco Island | 17.1 |
| Nebraska | Grand Island | 16.25 |
| Florida | Sebastian-Vero Beach-West Vero Corridor | 16.22 |
| Kansas | Kansas City | 15.27 |
| Florida | Pompano Beach | 15.12 |
| Ohio | Mansfield | 14.97 |
| Colorado | Pueblo | 14.97 |
| Texas | San Angelo | 14.63 |
| Mississippi | Hattiesburg | 14.3 |
| Alabama | Gadsden | 14.27 |
| Arkansas | Hot Springs | 13.78 |
| Illinois | Decatur | 13.44 |
| Oklahoma | Broken Arrow | 13.11 |
| Ohio | Lima | 12.63 |
| Georgia | Rome | 12.56 |
| Florida | Saint Petersburg | 12.5 |
| Illinois | Elk Grove Village | 12.27 |
| Alabama | Decatur | 11.99 |
| Montana | Billings | 11.99 |
| Texas | Irving | 11.94 |
| Texas | Waco | 11.7 |
| Florida | Punta Gorda | 11.61 |
| Pennsylvania | Williamsport | 11.36 |
| New York | Watertown-Fort Drum | 11.11 |
| Wisconsin | Sheboygan | 11.06 |
| Florida | Sebring | 11.01 |
| Texas | Lewisville | 10.8 |
| Ohio | Canton-Massillon | 10.76 |
| Georgia | Brunswick-St. Simons | 10.73 |
| Alabama | Auburn-Opelika | 10.46 |
| Ohio | Youngstown-Warren | 10.39 |
| Alabama | Mobile | 10.32 |
| Pennsylvania | Erie | 10.21 |
| Texas | Tyler | 10.15 |
| Kansas | Topeka | 10.15 |
| Texas | Longview | 10.14 |
| Georgia | Gainesville | 10.08 |
| Idaho | Pocatello | 9.92 |
| Kansas | Olathe | 9.75 |
| Texas | Texarkana | 9.73 |
| Idaho | Lewiston | 9.7 |
| Georgia | Hinesville | 9.58 |
| Pennsylvania | York-Hanover | 9.56 |
| Pennsylvania | Lebanon | 9.5 |
| Texas | Amarillo | 9.48 |
| Virginia | Newport News | 9.47 |
| Texas | Mesquite | 9.36 |
| Illinois | Rockford | 9.34 |
| Texas | Lubbock | 9.27 |
| Wisconsin | Janesville-Beloit | 9.24 |
| Nebraska | Lincoln | 9.22 |
| Pennsylvania | Harrisburg-Carlisle | 9.09 |
| North Dakota | Fargo | 9.08 |
| Florida | North Port-Bradenton-Sarasota | 9.01 |
| New York | Jamaica | 9.01 |
| Alabama | Montgomery | 8.99 |
| Texas | Victoria | 8.93 |
| Alabama | Dothan | 8.92 |
| Missouri | Springfield | 8.62 |
| Wisconsin | Kenosha | 8.44 |
| Wisconsin | Eau Claire | 8.34 |
| Texas | Corpus Christi | 8.18 |
| Texas | Abilene | 8.1 |
| Missouri | Cape Girardeau | 8.06 |
| Oklahoma | Tulsa | 8.04 |
| Georgia | Albany | 8.04 |
| Florida | Panama City-Panama City Beach | 7.8 |
| Wisconsin | La Crosse-Onalaska | 7.8 |
| Nebraska | Omaha | 7.76 |
| Florida | Jacksonville | 7.73 |
| Pennsylvania | Gettysburg | 7.71 |
| Wisconsin | Oshkosh-Neenah | 7.55 |
| Texas | Houston-Pasadena-The Woodlands | 7.5 |
| Pennsylvania | Lancaster | 7.49 |
| Kansas | Wichita | 7.44 |
| Illinois | Aurora | 7.43 |
| South Dakota | Sioux Falls | 7.41 |
| Pennsylvania | Reading | 7.27 |
| Louisiana | Shreveport-Bossier City | 7.23 |
| Louisiana | Lake Charles | 7.2 |
| North Dakota | Grand Forks | 7.14 |
| Florida | Pensacola-Ferry Pass-Brent | 7.08 |
| Florida | Lakeland-Winter Haven | 7.01 |
| Pennsylvania | Altoona | 6.89 |
| Arkansas | Fayetteville-Springdale-Rogers | 6.89 |
| Pennsylvania | Allentown-Bethlehem-Easton | 6.84 |
| Ohio | Sandusky | 6.81 |
| Illinois | Springfield | 6.74 |
| Montana | Missoula | 6.66 |
| Wisconsin | Wausau | 6.65 |
| Georgia | Savannah | 6.65 |
| Louisiana | Hammond | 6.63 |
| Idaho | Twin Falls | 6.62 |
| West Virginia | Charleston | 6.57 |
| Missouri | Jefferson City | 6.52 |
| Texas | Garland | 6.5 |
| Florida | Cape Coral-Fort Myers | 6.4 |
| Texas | Brownsville-Harlingen | 6.37 |
| Florida | Orlando-Kissimmee-Sanford | 6.34 |
| Texas | El Paso | 6.32 |
| Florida | Hialeah | 6.25 |
| Alabama | Huntsville | 6.2 |
| Alabama | Anniston-Oxford | 6.11 |
| Ohio | Dayton-Kettering-Beavercreek | 6.09 |
| Texas | Beaumont-Port Arthur | 6.06 |
| New Jersey | Newark | 6.06 |
| Arkansas | Fort Smith | 5.93 |
| Idaho | Idaho Falls | 5.91 |
| Arkansas | Little Rock-North Little Rock-Conway | 5.8 |
| Oklahoma | Lawton | 5.74 |
| New York | Elmira | 5.7 |
| Florida | Ocala | 5.68 |
| Texas | San Antonio-New Braunfels | 5.66 |
| West Virginia | Morgantown | 5.65 |
| Texas | Sherman-Denison | 5.63 |
| Colorado | Greeley | 5.6 |
| North Dakota | Bismarck | 5.47 |
| Georgia | Columbus | 5.46 |
| Maine | Lewiston-Auburn | 5.44 |
| Maine | Bangor | 5.34 |
| Texas | College Station-Bryan | 5.27 |
| Pennsylvania | State College | 5.12 |
| Missouri | Joplin | 5.11 |
| Wisconsin | Green Bay | 5.07 |
| West Virginia | Parkersburg-Vienna | 5.06 |
| South Dakota | Rapid City | 5 |
| Montana | Great Falls | 4.97 |
| Texas | Killeen-Temple | 4.97 |
| North Dakota | Minot | 4.91 |
| Washington | Bremerton-Silverdale-Port Orchard | 4.91 |
| Georgia | Valdosta | 4.86 |
| Ohio | Springfield | 4.82 |
| Alabama | Birmingham | 4.74 |
| Wisconsin | Madison | 4.69 |
| Texas | Dallas-Fort Worth-Arlington | 4.61 |
| Florida | Tallahassee | 4.43 |
| Oklahoma | Oklahoma City | 4.4 |
| West Virginia | Beckley | 4.29 |
| Alabama | Daphne-Fairhope-Foley | 4.29 |
| Ohio | Columbus | 4.2 |
| Texas | Eagle Pass | 4.16 |
| Florida | Crestview-Fort Walton Beach-Destin | 4.16 |
| Florida | Miami-Fort Lauderdale-West Palm Beach | 4.15 |
| Georgia | Atlanta-Sandy Springs-Roswell | 4.11 |
| New York | Ithaca | 4.1 |
| Louisiana | New Orleans-Metairie | 4.08 |
| Florida | Tampa-St. Petersburg-Clearwater | 4.07 |
| Ohio | Toledo | 4.05 |
| Alabama | Tuscaloosa | 3.98 |
| New York | Syracuse | 3.88 |
| Colorado | Grand Junction | 3.76 |
| Georgia | Augusta-Richmond County | 3.72 |
| Georgia | Athens-Clarke County | 3.7 |
| Colorado | Denver-Aurora-Centennial | 3.69 |
| Wisconsin | Appleton | 3.65 |
| Texas | Austin-Round Rock-San Marcos | 3.62 |
| Wisconsin | Fond Du Lac | 3.61 |
| Ohio | Cincinnati | 3.58 |
| Colorado | Colorado Springs | 3.57 |
| Delaware | Dover | 3.53 |
| Missouri | Columbia | 3.53 |
| Massachusetts | Amherst Town-Northampton | 3.52 |
| New York | Albany-Schenectady-Troy | 3.51 |
| Louisiana | Baton Rouge | 3.5 |
| Texas | Laredo | 3.39 |
| Illinois | Peoria | 3.38 |
| Georgia | Warner Robins | 3.34 |
| West Virginia | Wheeling | 3.33 |
| Texas | Mcallen-Edinburg-Mission | 3.3 |
| Illinois | Champaign-Urbana | 3.24 |
| Louisiana | Monroe | 3.14 |
| Massachusetts | Pittsfield | 3.14 |
| New Jersey | Vineland | 3.06 |
| Texas | Wichita Falls | 3.01 |
| Ohio | Cleveland | 3.01 |
| Florida | Gainesville | 2.99 |
| Wisconsin | Racine-Mount Pleasant | 2.97 |
| New York | Bronx | 2.96 |
| New York | Rochester | 2.92 |
| Alabama | Florence-Muscle Shoals | 2.91 |
| Wisconsin | Milwaukee-Waukesha | 2.7 |
| Missouri | Kansas City | 2.67 |
| Pennsylvania | Pittsburgh | 2.66 |
| Florida | Palm Bay-Melbourne-Titusville | 2.63 |
| Pennsylvania | Chambersburg | 2.59 |
| Colorado | Boulder | 2.57 |
| West Virginia | Huntington-Ashland | 2.54 |
| Connecticut | New Haven | 2.53 |
| New Jersey | Trenton-Princeton | 2.52 |
| New Hampshire | Manchester-Nashua | 2.51 |
| Mississippi | Jackson | 2.49 |
| Idaho | Boise City | 2.48 |
| Florida | Deltona-Daytona Beach-Ormond Beach | 2.48 |
| New York | Buffalo-Cheektowaga | 2.33 |
| New York | Kingston | 2.29 |
| Louisiana | Houma-Bayou Cane-Thibodaux | 2.29 |
| Illinois | Chicago-Naperville-Elgin | 2.19 |
| Mississippi | Gulfport-Biloxi | 2.13 |
| Connecticut | Norwich-New London-Willimantic | 2.11 |
| Montana | Helena | 2.07 |
| New Mexico | Farmington | 2 |
| Connecticut | Bridgeport-Stamford-Danbury | 1.93 |
| Ohio | Weirton-Steubenville(2) | 1.92 |
| Florida | Homosassa Springs | 1.87 |
| New York | Glens Falls | 1.69 |
| New Jersey | Atlantic City-Hammonton | 1.67 |
| Louisiana | Alexandria | 1.58 |
| New York | Utica-Rome | 1.57 |
| Louisiana | Lafayette | 1.52 |
| New York | Kiryas Joel-Poughkeepsie-Newburgh | 1.47 |
| Kansas | Lawrence | 1.42 |
| Ohio | Akron | 1.39 |
| Massachusetts | Springfield | 1.34 |
| North Carolina | Jacksonville | 1.34 |
| North Carolina | Fayetteville | 1.3 |
| Maine | Portland-South Portland | 1.28 |
| Montana | Bozeman | 1.28 |
| Michigan | Monroe | 1.24 |
| Virginia | Blacksburg-Christiansburg-Radford | 1.09 |
| Massachusetts | Worcester | 1.08 |
| Pennsylvania | Scranton–Wilkes-Barre | 1.07 |
| Illinois | Bloomington | 1.03 |
| Pennsylvania | Philadelphia-Camden-Wilmington | 0.97 |
| Colorado | Fort Collins-Loveland | 0.95 |
| North Carolina | Asheville | 0.94 |
| New York | Binghamton | 0.94 |
| California | San Diego-Chula Vista-Carlsbad | 0.92 |
| Connecticut | Waterbury-Shelton | 0.83 |
| Virginia | Charlottesville | 0.83 |
| Washington | Yakima | 0.81 |
| Virginia | Virginia Beach-Chesapeake-Norfolk | 0.79 |
| District Of Columbia | Washington-Arlington-Alexandria | 0.76 |
| Rhode Island | Providence-Warwick | 0.67 |
| Connecticut | Hartford-West Hartford-East Hartford | 0.65 |
| New Mexico | Albuquerque | 0.65 |
| South Carolina | Myrtle Beach-Conway-North Myrtle Beach | 0.58 |
| Massachusetts | Boston-Cambridge-Newton | 0.5 |
| Alaska | Anchorage | 0.5 |
| South Carolina | Charleston-North Charleston | 0.45 |
| Hawaii | Urban Honolulu | 0.43 |
| Nevada | Las Vegas-Henderson-North Las Vegas | 0.41 |
| California | Santa Rosa-Petaluma | 0.41 |
| Nevada | Reno | 0.33 |
| California | Bakersfield-Delano | 0.25 |
| Iowa | Des Moines-West Des Moines | 0.24 |
| New York | New York-Newark-Jersey City | 0.22 |
| Tennessee | Nashville-Davidson–Murfreesboro–Franklin | 0.17 |
| Minnesota | Minneapolis-St. Paul-Bloomington | 0.14 |
| Virginia | Richmond | 0.14 |
| North Carolina | Charlotte-Concord-Gastonia | 0.13 |
| North Carolina | Raleigh-Cary | 0.12 |
| Indiana | Indianapolis-Carmel-Greenwood | 0.09 |
| Arizona | Phoenix-Mesa-Chandler | 0.07 |
| Oregon | Portland-Vancouver-Hillsboro | 0.07 |
| Maryland | Baltimore-Columbia-Towson | 0.07 |
| Michigan | Detroit-Warren-Dearborn | 0.05 |
| Washington | Seattle-Tacoma-Bellevue | 0.04 |
| California | San Francisco-Oakland-Fremont | 0.04 |
| California | Los Angeles-Long Beach-Anaheim | 0.03 |